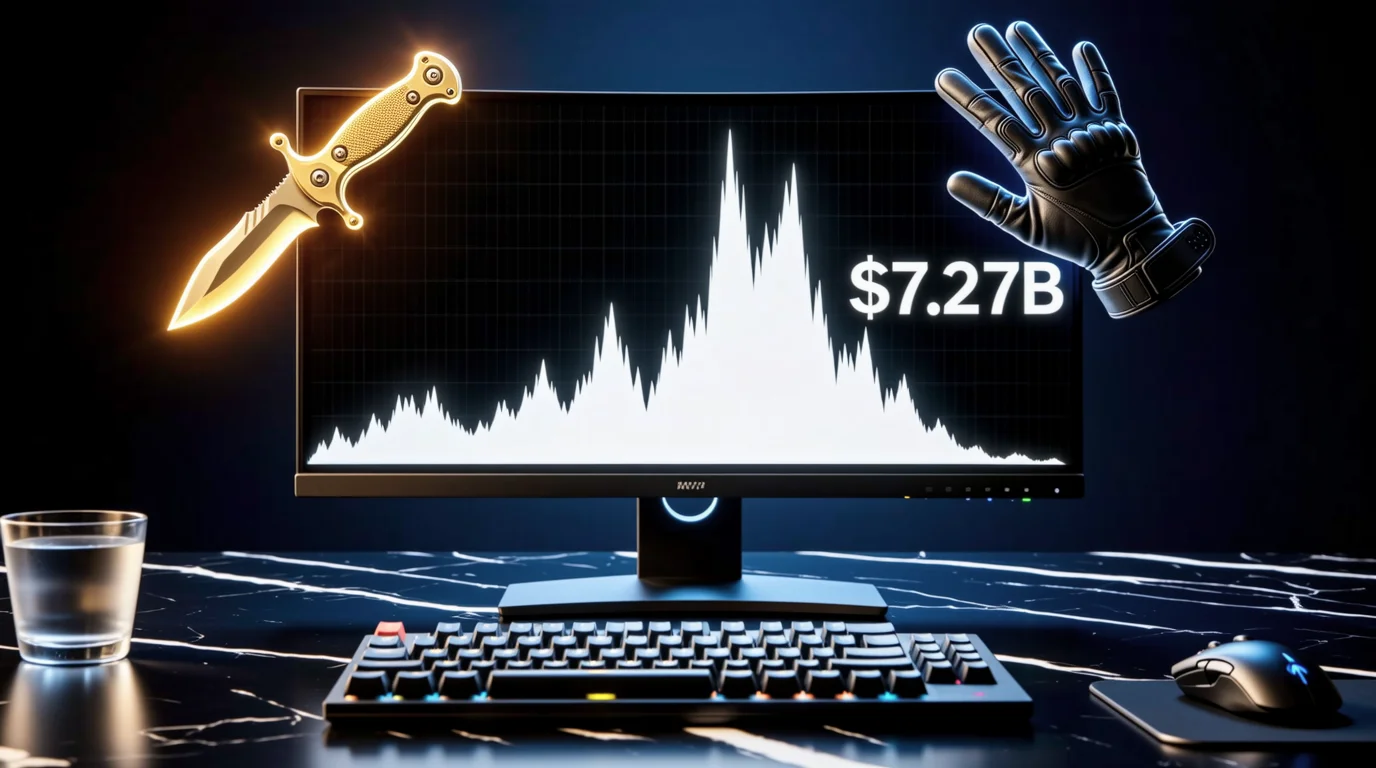
By mid-2026, the CS2 skin economy had climbed back to multi-billion-dollar scale: data platforms on June 24, 2026 estimated total market capitalization near $7.27 billion, up from a 2025 crash bottom around $3.37 billion. Through August 2026, trackers still placed aggregate cap in the high-$6B to low-$7B band—a V-shaped recovery, not a straight line back to speculative highs. These numbers confirm what traders already felt in their inventories: CS2 skins are no longer casual cosmetics—they are a cyclical virtual asset market with real liquidity, real risk, and real recovery phases.
For ongoing macro context, pair this analysis with our Q1 2026 CS2 skins market research report and the June 24, 2026 market pulse.
CS2 Skins as an Alternative Asset Class
Multiple 2026 market studies treat CS2 skins as an alternative asset with price discovery, volatility cycles, and portfolio-like behavior. Early on, skins were pure consumption goods—players bought what looked cool. As Steam Community Market and third-party venues matured, they became scarce digital assets with cross-region pricing and 24/7 liquidity.
Reports note CS2 skin market cap peaked above $14 billion in early 2025 before major system updates triggered a deep correction. Even after a 50%+ drawdown, the market still commanded $7+ billion in estimated value by mid-2026—large enough for game-economy researchers to treat seriously.
If you are evaluating skins as investments rather than loadout upgrades, read Are CS2 Skins a Good Investment in 2026? for a balanced risk framework.
Calculating the Market Cap of Virtual Items
CS2 market cap uses the same logic as traditional market capitalization:
Estimated circulating supply × median market price, summed across all skin categories.
Platforms like CSMarketCap aggregate Steam Community Market, Buff163, CSFloat, Skinport, and other venues, then algorithmically estimate each skin's contribution to total cap.
How aggregators build the number
| Step | What happens |
|---|---|
| 1. Segment | Split inventory into knives, gloves, rifles, stickers, cases, agents, etc. |
| 2. Supply model | Estimate float-weighted circulating units from drop history, case openings, and trade-up sinks |
| 3. Price input | Take median or volume-weighted prices across Steam CM + major third-party venues |
| 4. Sum | Multiply supply × price per item, aggregate to total cap |
Methods differ by vendor—some overweight Steam list prices, others Buff163 clearing prices—so treat any single cap print as a directional estimate, not gospel.
The 2025–2026 recovery timeline
SkinVS and similar trackers described the arc clearly:
| Period | Estimated market cap |
|---|---|
| Peak (early 2025) | ~$14B+ |
| Post-crash low (Oct 2025) | ~$3.37B |
| Jan 2026 | ~$4.5B |
| Mar 2026 | ~$5.8B |
| Jun 24, 2026 | ~$7.27B |
| Aug 2026 (stabilization) | ~$6.5B–$7.2B |
That is roughly +115% from the October bottom to the June peak print, followed by a flatter consolidation phase into August. Steam Community Market daily turnover near $5.2M (June 2026 snapshot) suggests real transaction flow—not just inflated ask prices sitting on listings.
Technically, aggregators segment by category (knives, gloves, rifles, stickers, cases), model float supply using drop history and case openings, then apply median cross-platform prices. For individual traders, the practical move is simpler: use take.skin to price your holdings across markets and treat your inventory as a personal portfolio.
The Supply and Demand Dynamics of Discontinued Items
Discontinued skins and cases are the clearest scarcity-driven segment in CS2.
Early collections (Cobblestone, Norse themes) and legacy weapon cases removed from active drop pools have shown long-term exponential appreciation: new supply approaches zero while demand persists—or gets amplified by hype cycles.
During the 2025–2026 crash and recovery:
- Knives rebounded roughly 245% from October lows (tracker-dependent; category-wide, not every finish)
- Top-tier rifles (AK, AWP, M4 finishes) showed widening wear premiums—Factory New vs Field-Tested spreads of 2–3× on the same skin
As discontinued case supply gets opened, traded, or locked in banned accounts, float concentrates in long-term holders. Secondary prices become more sensitive to whale behavior.
Explore scarcity plays in our guides to discontinued CS2 cases and most expensive CS2 skins.
The Role of Sinks: Trade-Ups and VAC Bans
Sustainable virtual economies need deflation mechanisms. CS2 has two major ones:
Trade-Up Contracts
Players destroy 10 lower-tier skins to craft one higher-tier output. This permanently removes inputs from circulation and supports top-tier scarcity in collections like Cobblestone and Operation Bravo.
The October 2025 trade-up formula change was a macro shock—it broke years of arbitrage expectations and helped trigger the crash. Long term, though, trade-ups remain the primary supply sink for mid-tier assets.
Read our trade-up contract guide before betting on craft-based strategies.
VAC Bans
Banned accounts cannot trade. Inventory locked on VAC'd accounts is effectively removed from circulating supply—a slow but real deflationary force across a multi-billion-dollar market.
Combined with natural player churn, the CS2 skin supply curve trends net deflationary over long horizons, supporting rare asset floors.
take.skin Macro Outlook
After a violent ~50% correction, CS2 skins entered a more mature but still uncertain phase in 2026. Market cap recovery from ~$3.37B to ~$7.27B shows player demand and collector capital remain active. Recovery drivers look less like pure speculation and more like:
- Real loadout demand (players buying skins they actually use)
- Esports and content exposure
- Improved third-party market efficiency
Long-term sustainability still hinges on Valve policy and global regulation. Any major change to drop rates, trade-up math, or market fees can reprice the entire asset pool overnight. Regulatory pressure on skin gambling and cash-trading platforms also affects venue availability.
For take.skin users, the robust playbook is unchanged: treat skins as high-volatility virtual assets, not savings accounts. Prioritize items you would hold through a 50% drawdown because you genuinely want them in-game.
Track your portfolio value on take.skin and monitor macro shifts via our how Chinese collectors changed CS2 market analysis.